

You are using an out of date browser. It may not display this or other websites correctly.
You should upgrade or use an alternative browser.
You should upgrade or use an alternative browser.
I'm not a conspiracy theorist, but...
- Thread starter DAVE_M
- Start date
The Best online firearms community in Louisiana.
Member Benefits:
Fewer Ads! Discuss all aspects of firearm ownership Discuss anti-gun legislation Buy, sell, and trade in the classified section Chat with Local gun shops, ranges, trainers & other businesses Discover free outdoor shooting areas View up to date on firearm-related events Share photos & video with other members ...and so much more!
Member Benefits:

Yes, when I look at the numbers from the local hospitals some of the positive values don't fit what we see in the hospital and what they're reporting in the news. I remember when the news was reporting that there were no available beds in the hospitals, but when I went there the floors were empty and they were laying off nurses and doctors.
Yes, when I look at the numbers from the local hospitals some of the positive values don't fit what we see in the hospital and what they're reporting in the news. I remember when the news was reporting that there were no available beds in the hospitals, but when I went there the floors were empty and they were laying off nurses and doctors.
I have been told by multiple nurses that there are less patients than previous months at five of the local hospitals. Strangely the numbers keep increasing. I haven’t had a test done, nor do I know how the testing data is recorded, but if I didn’t show symptoms, never get sick, but tested positive... what does that mean on paper?
Yes, there are less patients at the hospitals. Realistically, we're all going to be carriers of the virus. No one is going to be free of the virus. The good news is that most of us won't show any symptoms. I wouldn't worry about it. There are worse bacteria and viruses out there that no one talks about.
Bangswitch
Well-Known Member
Yes, there are less patients at the hospitals. Realistically, we're all going to be carriers of the virus. No one is going to be free of the virus. The good news is that most of us won't show any symptoms. I wouldn't worry about it. There are worse bacteria and viruses out there that no one talks about.
Yeah a certain COVID safe sex flier comes to mind. I’ll try to be sensitive but it warned Covid being shed through your backside. Now the didn’t mention e. Coli, c. Diff, or the regular old run of them mill STD’s.
GunRelated
Well-Known Member
Interesting find. Thank you for sharing.Sure does make you wonder
https://www.fox35orlando.com/news/f...s-have-not-reported-negative-covid-19-results
Closer to home Da Sheriff on WWL Radio had a guy call in with his story. Him & his wife went to drivethru testing. They fill out the forms but it was taking way to long for the actual test, so they left. A few days later they got positive results. So they tested pos. without a real test. How many others like that are out there.
Conspiracy or Incompatace.
Conspiracy or Incompatace.
Yes, there are less patients at the hospitals. Realistically, we're all going to be carriers of the virus. No one is going to be free of the virus. The good news is that most of us won't show any symptoms. I wouldn't worry about it. There are worse bacteria and viruses out there that no one talks about.
I agree.
However, none of those have shut down businesses.
The source material is here - http://ww11.doh.state.fl.us/comm/_partners/covid19_report_archive/state_reports_latest.pdf
If you scroll down to page 25 of 49 you'll get to the data directly from the testing facilities. I exported the data to Google Sheets so I could easily work with it because I'm a nerd and I love data. Here's a link if you wanted to look at it as well. https://docs.google.com/spreadsheets/d/11C1xeDU9Q6fYXvYcsCKDUzJFbz8wM0ceWYR6PtfmTHo/edit?usp=sharing
There were 465 locations that reported 100% positive results from tests. These locations reported 5,564 total positive cases. Of those, 205 only reported 1 test administered (44%). 137 reported between 2 and 5 total tests administered (29%). 81 reported between 6 and 20 tests administered (17%), and 42 reported 21+ tests administered (9%).
There were 152 locations that reported between 50% and 99%. These locations reported 8,299 total positive cases.
There were 375 locations that reported between 0% and 49%. These locations reported 349,965 total positive cases.
So let's say the 617 locations with 50% and higher positive results were all part of the conspiracy and were sending false information to make the virus look worse than it is. The overall total on the report would drop from 363,828 to 349,965 positive infections. Those 617 locations only accounted for 4% of the grand total on the report.
The top 35 locations on that report account for 292,393 of the positive cases which is 83.5% of the total. The highest percent of positive cases of these 35 is 24% (VIRACOR-EUROFINS LABORATORIES 19,230 Negative, 5,967 Positive, 24% Positive Pct, 25,197 Total tests administered)
So what's more likely, a global conspiracy involving every single country of the world working together to "muzzle" Americans or some smaller facilities are screwing up the data they're reporting while the larger facilities are doing it correctly?
The source material is here - http://ww11.doh.state.fl.us/comm/_partners/covid19_report_archive/state_reports_latest.pdf
If you scroll down to page 25 of 49 you'll get to the data directly from the testing facilities. I exported the data to Google Sheets so I could easily work with it because I'm a nerd and I love data. Here's a link if you wanted to look at it as well. https://docs.google.com/spreadsheets/d/11C1xeDU9Q6fYXvYcsCKDUzJFbz8wM0ceWYR6PtfmTHo/edit?usp=sharing
There were 465 locations that reported 100% positive results from tests. These locations reported 5,564 total positive cases. Of those, 205 only reported 1 test administered (44%). 137 reported between 2 and 5 total tests administered (29%). 81 reported between 6 and 20 tests administered (17%), and 42 reported 21+ tests administered (9%).
There were 152 locations that reported between 50% and 99%. These locations reported 8,299 total positive cases.
There were 375 locations that reported between 0% and 49%. These locations reported 349,965 total positive cases.
So let's say the 617 locations with 50% and higher positive results were all part of the conspiracy and were sending false information to make the virus look worse than it is. The overall total on the report would drop from 363,828 to 349,965 positive infections. Those 617 locations only accounted for 4% of the grand total on the report.
The top 35 locations on that report account for 292,393 of the positive cases which is 83.5% of the total. The highest percent of positive cases of these 35 is 24% (VIRACOR-EUROFINS LABORATORIES 19,230 Negative, 5,967 Positive, 24% Positive Pct, 25,197 Total tests administered)
So what's more likely, a global conspiracy involving every single country of the world working together to "muzzle" Americans or some smaller facilities are screwing up the data they're reporting while the larger facilities are doing it correctly?
Are we to assume larger facilities don’t make mistakes?
If I’m reading the numbers correctly, less than 1% were hospitalized and less than 0.2% were deaths.
Last edited:
Closer to home Da Sheriff on WWL Radio had a guy call in with his story. Him & his wife went to drivethru testing. They fill out the forms but it was taking way to long for the actual test, so they left. A few days later they got positive results. So they tested pos. without a real test. How many others like that are out there.
Conspiracy or Incompatace.
LOL. I mentioned this same story earlier. Funny thing is, the same story is being spread as happening in my wife’s home state if Illinois as well. I think it’s more BS being spread
Sent from my iPhone using Tapatalk Pro
Are we to assume larger facilities don’t make mistakes?
If I’m reading the numbers correctly, less than 1% were hospitalized and less than 0.2% were deaths.
I think everyone makes mistakes. Nobody's perfect but I believe people are trying their best.
I am having a bit of difficulty following that PDF though. If you go to the last page it shows you totals from the facilities. In my spreadsheet, I confirmed the totals so they didn't screw the math up. If you compare it the data on page 1 the numbers are quite a bit lower. So it's possible they discarded 72k positive results from the test centers they needed to get better numbers from for the overall report summary.
Code:
Page  Inconclusive  Negative    Positive Percentpositive  Total
Last  8,839         2,957,751   363,828  11%              3,330,418
First 3,123         2,393,614   291,629                   2,688,366
If you go by the data on page 1, then 6.5% of the positive cases were hospitalized and 1.5% of positive cases resulted in death.
Also, I decided to grab the latest on hospitalization numbers for all the US and charted them. Doesn't paint a good picture. But odd so many people are currently hospitalized but so few in ICU or on ventilators.
The data is taken from https://covidtracking.com/api/v1/us/daily.csv

Last edited:
Bigchillin83
Well-Known Member
How is the same exact virus way less deadly now, 99% less infected on ventilators, icu, severe symptoms ect... has the human race really been able to over come this virus that fast or are all the positive test numbers bogus?  maybe it’s the state mandated mask that’s helping...
 wait to see how many positive case we have now with them offering free test and free fast food vouchers for testing on an LSU campus... lol mysteriously it will be 99.9% of the people tested will be positive lol
maybe it’s the state mandated mask that’s helping... wait to see how many positive case we have now with them offering free test and free fast food vouchers for testing on an LSU campus... lol mysteriously it will be 99.9% of the people tested will be positive lolI think there's a very good chance what you suspect is the case. There should be no doubt by now that Covid-19 has been politicized, and bad numbers are seen as an ally for a particular presidential nominee not named Donald John Trump. Cooking the numbers should be expected, sad to say.
Many on the opposing side WANT the economy to suffer. Bill Maher actually said it. Bad Covid news equals economic obstacles. The dishonest creatures at those Orlando labs probably think they're "helping the cause".
Many on the opposing side WANT the economy to suffer. Bill Maher actually said it. Bad Covid news equals economic obstacles. The dishonest creatures at those Orlando labs probably think they're "helping the cause".
I think everyone makes mistakes. Nobody's perfect but I believe people are trying their best.
I am having a bit of difficulty following that PDF though. If you go to the last page it shows you totals from the facilities. In my spreadsheet, I confirmed the totals so they didn't screw the math up. If you compare it the data on page 1 the numbers are quite a bit lower. So it's possible they discarded 72k positive results from the test centers they needed to get better numbers from for the overall report summary.
Code:Page Inconclusive Negative Positive Percentpositive Total Last 8,839 2,957,751 363,828 11% 3,330,418 First 3,123 2,393,614 291,629 2,688,366
If you go by the data on page 1, then 6.5% of the positive cases were hospitalized and 1.5% of positive cases resulted in death.
Also, I decided to grab the latest on hospitalization numbers for all the US and charted them. Doesn't paint a good picture. But odd so many people are currently hospitalized but so few in ICU or on ventilators.
The data is taken from https://covidtracking.com/api/v1/us/daily.csv
So you agree that less than 1% were hospitalized and less than 0.2% were deaths.
The point I’m attempting to make is it seems people like to interpret the numbers to fit their narrative.
GunRelated
Well-Known Member
Some numbers from Texas.
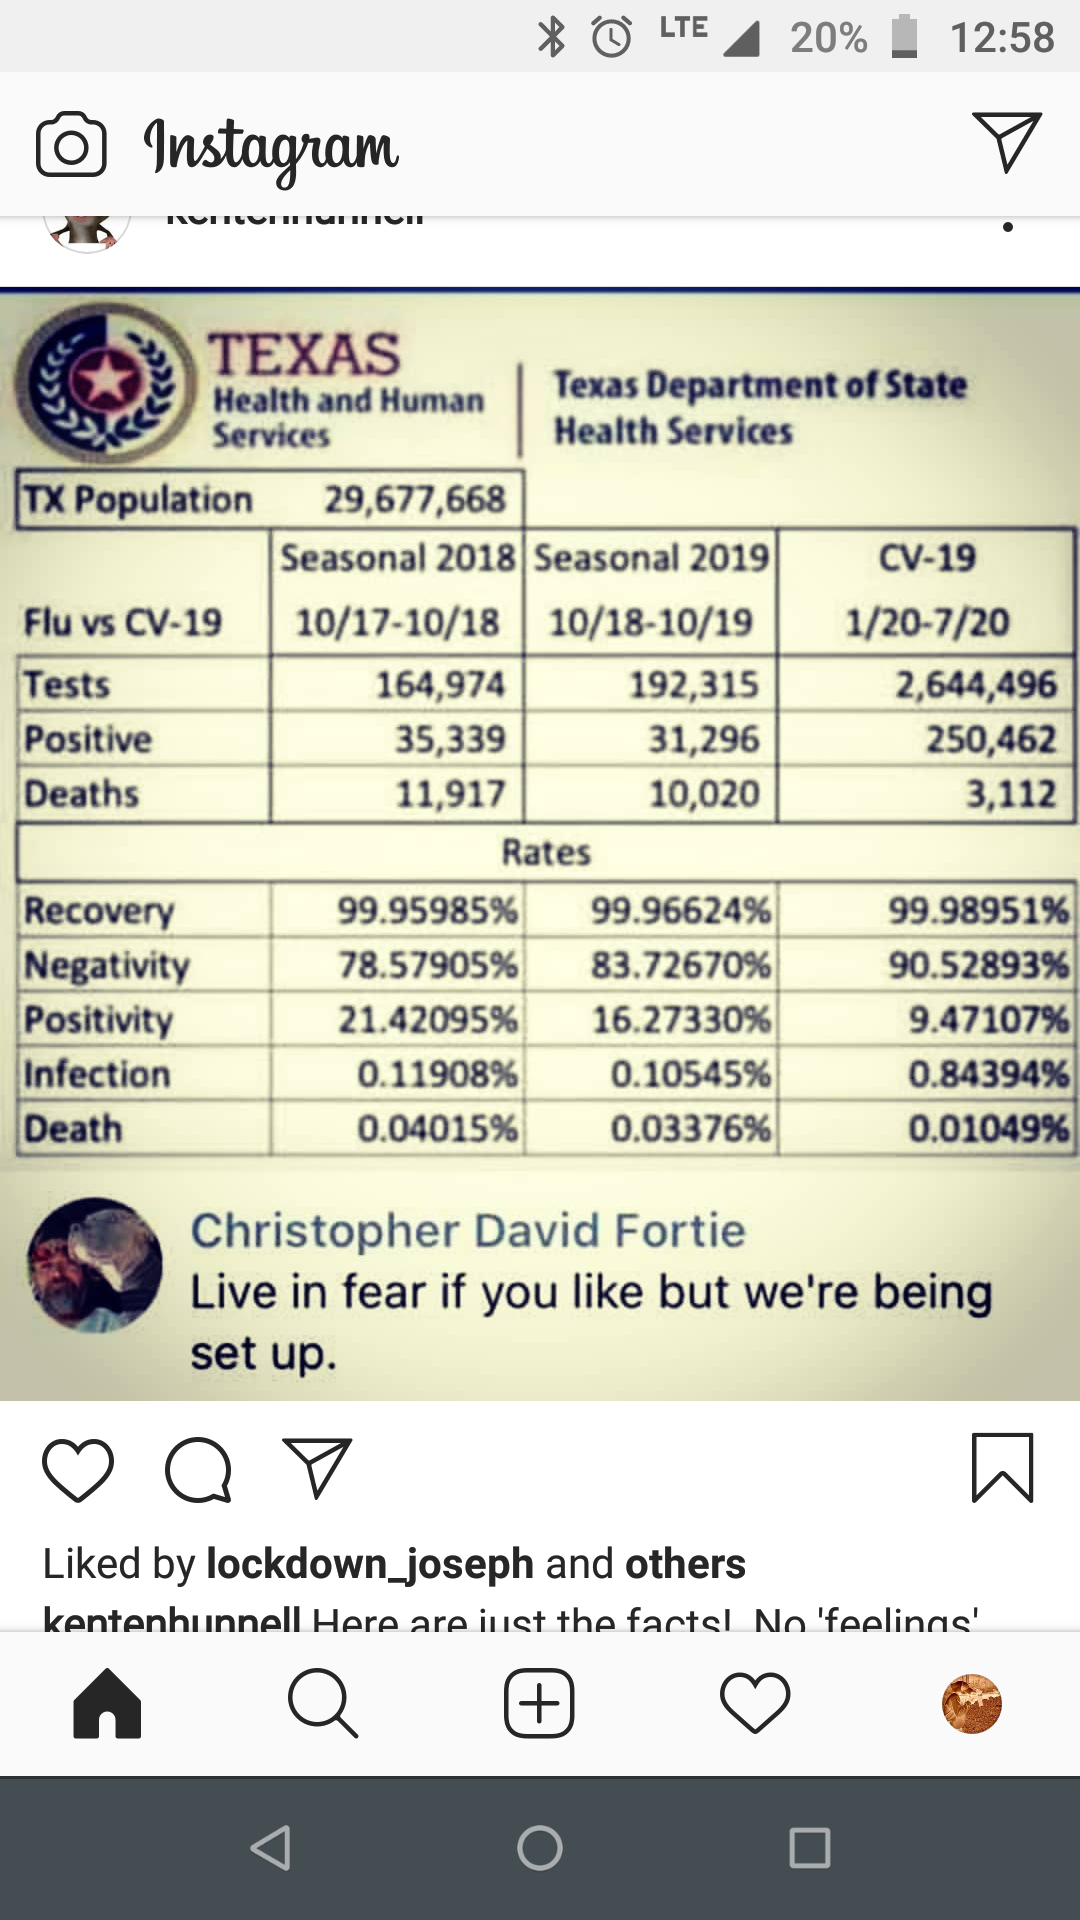
So you agree that less than 1% were hospitalized and less than 0.2% were deaths.
The point I’m attempting to make is it seems people like to interpret the numbers to fit their narrative.
I'm not the data analyst that produced the PDF. If I had to guess, the data on page 1 is what they decided is the most accurate data to present. That doesn't show 1% hospitalized and 0.2% deaths. I don't know where you're getting those numbers from because they say they had 19,334 hospitalizations and 4,626 deaths. Even if you divide those numbers by the bigger number (363,828) it's 5% hospitalized and and 1.2% deaths. So I guess you're making the point that you're changing the numbers to fit your narrative?
I'm not the data analyst that produced the PDF. If I had to guess, the data on page 1 is what they decided is the most accurate data to present. That doesn't show 1% hospitalized and 0.2% deaths. I don't know where you're getting those numbers from because they say they had 19,334 hospitalizations and 4,626 deaths. Even if you divide those numbers by the bigger number (363,828) it's 5% hospitalized and and 1.2% deaths. So I guess you're making the point that you're changing the numbers to fit your narrative?
From the PDF
Total Tested: 2,739,169
Total Positive: 301,810
Total Negative: 2,434,143
Inconclusive: 3,216
Of the 310,810 Total Positive Cases, 19,334 were hospitalized. If there were 301,810 positive out of a total 2,739,169 tested, then that's 11% of the total tested that showed positive. 19,334 hospitalized out of 2,739,169 tests is only 0.007%. Out of those 19,334 hospitalized, there were 4,521 deaths. That's 0.0017% (less than 2%) of the total number or tests.
That's the numbers provided.
Can you elaborate on where you found your numbers from? I'm looking at the percentage of hospitalized and percentage of deaths from the total number tested. Is that what you're doing? Why or why not?
Last edited:
Staff online
-
 340six-Global Mod-
Members online
- mickey
- 5ducks
- BillnLA
- rdmol
- Jonnygumbo
- Beckys_man
- southerner985
- Roadhog
- bnewman13
- DRB88
- RGWalker
- jcm629
- DBMJR1
- jonesnola
- J. W. Harris
- 70mikenike70
- Lost Bayou
- hotbiggun
- Dblank985
- mbuzha
- Fordfella
- Speedtrucker
- Arbiterk
- sawgrass
- numberonedad72
- Denisbl0
- pandabear
- Brballistics
- Saizan
- M6scout
- Dblb
- GunRelated
- ry_kj_an
- cetmeguy
- 700Camo
- Abby Normal
- vr1967
- Gator 45/70
- Tacosta304
- MyTFAL
- JD10
- 340six
- Joeyd701
- pangris1
- rebelray84
- LFKLshooter
- Jsonier820
- dmh
- Golden Ruger
- Niwsbuc
Total: 4,985 (members: 93, guests: 4,892)